A comprehensive data analytics project analyzing Cyclistic's bike usage patterns to develop data-driven strategies for increasing annual memberships through MySQL data cleaning and insightful Tableau Dashboard visualizations.
How do annual members and casual riders use Cyclistic bikes differently?
Why would casual riders buy Cyclistic annual memberships?
How can Cyclistic use digital media to influence casual riders to become members?
Statement of the Business Task
Cyclistic, a Chicago-based bike-share company, is focused on increasing its number of annual memberships. To support this goal, the marketing analyst team needs to understand how annual members and casual riders use Cyclistic bikes differently. Specifically, the task is to analyze riding patterns to develop a strategy that converts casual riders into annual members.
Data Sources Used
The analysis was conducted using data from Cyclistic’s bike-share system, which includes detailed ride data. The data was processed using MySQL, and the insights were visualized through Tableau Dashboards. The key data points analyzed include:
Ride Details: Ride ID, start and end times, station names, and geographical coordinates.
User Information: Membership type (casual vs. annual).
Rideable Type: The type of bike used (e.g., electric, classic).
Time Metrics: Ride duration, day of the week, and hourly trends.
Use Cyclistic’s historical trip data to analyze and identify trends. Download the previous 12 months of Cyclistic trip data here. (Note: The datasets have a different name because Cyclisticis a fictional company. For the purposes of this case study, the datasets are appropriate and will enable you to answer the business questions. The data has been made available by Motivate International Inc. under this license.) This is public data that you can use to explore how different customer types are using Cyclistic bikes. But note that data-privacy issues prohibit you from using riders’ personally identifiable information. This means that you won’t be able to connect pass purchases to credit card numbers to determine if casual riders live in the Cyclistic service area or if they have purchased multiple single passes.
Data Cleaning and Manipulation
Before conducting any analysis, it was essential to clean and prepare the data to ensure accuracy.
Handling Missing Values
Missing or incomplete data entries were identified and removed to prevent any skewed results. The SQL code for this process was:
The data analysis was divided into several key areas to understand how casual riders and annual members use Cyclistic bikes differently.
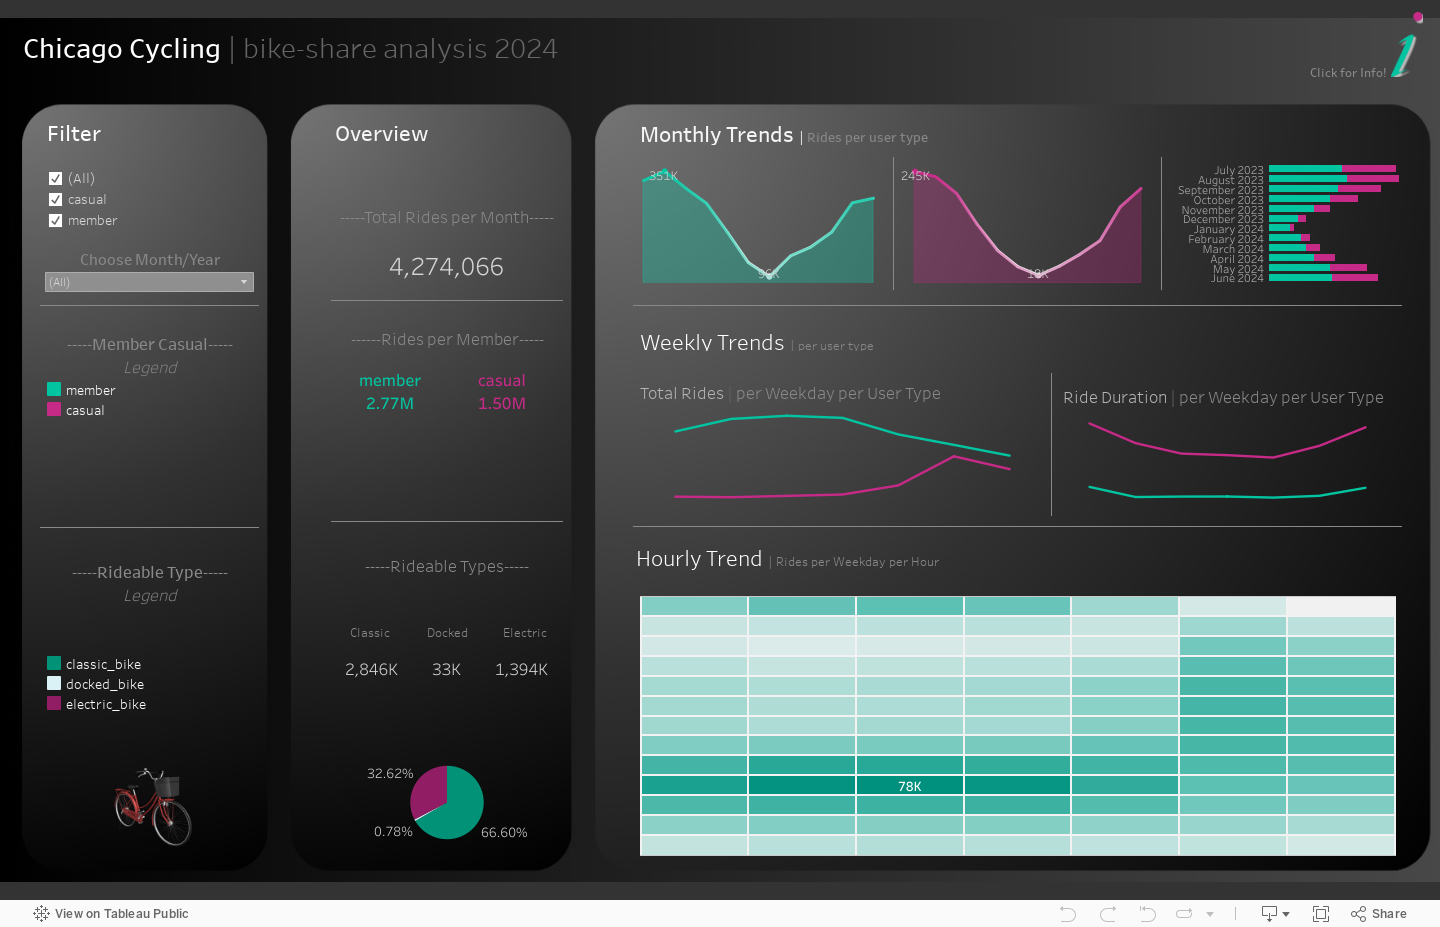
Total Rides Per Month This metric provided insight into the overall usage of Cyclistic bikes throughout the year. The total rides per month were calculated and displayed on the Tableau Dashboard.
Insight: The total number of rides per month varied significantly throughout the year, with a noticeable increase during the warmer months (May to September). This indicates a seasonal trend where bike usage spikes in summer, likely due to more favorable weather conditions.
Monthly Trends Monthly trends were analyzed to observe the fluctuations in bike usage across different months. This was visualized using a stacked bar chart that compared the usage between casual riders and annual members.
Insight: The monthly trends revealed that both casual riders and annual members increased their bike usage during the summer months. However, casual riders showed a sharper increase, which suggests that marketing campaigns during this period could be highly effective in converting casual riders into annual members.
Rides Per Member By analyzing the total number of rides per member, we gained a clearer understanding of the engagement levels of casual riders versus annual members.
Insight: Annual members consistently had a higher number of rides compared to casual riders. This suggests that annual members use Cyclistic bikes more frequently, possibly for daily commuting or regular short trips.
Rideable Type Distribution The distribution of rideable types (e.g., classic bikes, electric bikes) was analyzed, and a pie chart was created to visually represent the percentage of each type used by riders.
Insight: The distribution of rideable types (classic bikes vs. electric bikes) showed that classic bikes were more popular overall. However, there was a significant proportion of users who preferred electric bikes, especially among casual riders, indicating a potential area for targeted marketing or fleet adjustments.
Weekly Trends Weekly trends were analyzed to determine the average number of rides per user type throughout the week. This data was visualized using a line chart on the Tableau Dashboard.
Insight: Weekly trends analysis showed that casual riders tend to use bikes more on weekends, whereas annual members have a more consistent usage pattern throughout the week, with slight peaks on weekdays. This indicates that casual riders are more likely to use bikes for leisure, while annual members use them for more routine activities.
Average Ride Duration The average ride duration for casual riders and annual members was calculated and visualized over the course of the week, providing insights into the different riding behaviors.
Insight: Casual riders have longer average ride durations compared to annual members. This suggests that casual riders may be using the bikes for leisurely exploration or longer trips, as opposed to the quick commutes or short errands typically done by annual members.
Hourly Trends Using a heat map, the analysis identified the times of day during the week when bike usage was at its peak for both casual riders and annual members. This provided valuable insights for optimizing bike availability and marketing strategies.
Insight: The heat map analysis identified peak usage hours during the day. For casual riders, the busiest times were late mornings and afternoons, especially on weekends. For annual members, the peak times were during the morning and evening commute hours on weekdays. This insight can help Cyclistic optimize bike availability and tailor promotional efforts to these peak times.
Top Three Recommendations with Actionable Examples
Incentivizing Membership Conversion
Recommendation: Cyclistic should create a targeted campaign to encourage casual riders to convert to annual memberships by offering tailored incentives based on their riding behavior.
Actionable Example:
Launch a "Ride More, Save More" Program: Cyclistic could introduce a program where casual riders earn points or discounts towards an annual membership based on their ride frequency and duration. For instance, if a casual rider completes 10 rides in a month or exceeds a cumulative ride time of 5 hours, they receive a 20% discount on an annual membership. This program directly rewards active casual riders, nudging them towards the benefits of becoming annual members.
Offer a Limited-Time Trial Membership: Provide a one-month trial annual membership at a reduced rate for casual riders who have used Cyclistic bikes more than 15 times in the past two months. This trial would allow casual riders to experience the full benefits of membership, including perks like free rides for the first 45 minutes and priority access to bikes, encouraging them to commit long-term.
Optimizing Marketing at Peak Times
Recommendation: Utilize data-driven insights about peak usage times to optimize digital marketing efforts, targeting casual riders when they are most likely to be active.
Actionable Example:
Schedule Ads During Peak Usage Hours: Based on the heat map analysis, Cyclistic can schedule targeted digital ads to appear during the late morning and afternoon hours on weekends when casual riders are most active. These ads could highlight the cost savings and convenience of an annual membership, with messages like, “Love biking on weekends? Save more with an annual membership!” to resonate with their existing behavior.
Send Push Notifications with Time-Sensitive Offers: For casual riders who are part of the Cyclistic app, push notifications could be sent during peak usage times offering limited-time promotions. For example, a notification at 10 AM on a Saturday might say, “Ride more today? Get $10 off an annual membership if you sign up before midnight!” This creates a sense of urgency and capitalizes on the user’s current engagement with the service.
Enhancing Rideable Type Availability
Recommendation: Adjust the fleet distribution to ensure that the most popular rideable types, particularly electric bikes, are readily available during peak usage times and at high-demand stations.
Actionable Example:
Reallocate Electric Bikes to High-Demand Areas: From the rideable type distribution analysis, it’s clear that electric bikes are in high demand, especially among casual riders. Cyclistic could strategically position more electric bikes at stations that see higher casual rider traffic, particularly on weekends and during peak hours identified by the heat map. For instance, stations near popular tourist attractions or parks could have an increased supply of electric bikes.
Introduce a Rideable Type Reservation Feature: Cyclistic could develop a feature in their app allowing riders to reserve electric bikes in advance at certain high-traffic stations. This would cater to the preferences of casual riders, making it more likely that they choose Cyclistic over other transportation options, and could be paired with prompts to consider the benefits of membership, such as guaranteed availability for members.
These actionable strategies are designed to leverage the data insights gathered from the analysis, ensuring that Cyclistic not only increases its annual memberships but also enhances overall customer satisfaction and loyalty. By aligning marketing efforts with the identified behavior patterns of casual riders, Cyclistic can effectively drive membership growth and improve the user experience across the board.